Devtools
Weex devtools is a custom devtools for weex that implements Chrome Debugging Protocol, it is designed to help you quickly inspect your app and debug your JS bundle source in a chrome web page, both Android and IOS platform are supported.
Install
$ npm install -g weex-toolkit
usage
weex debug [options] [we_file|bundles_dir]

  Options:

    -h, --help           output usage information
    -V, --verbose        display logs of debugger server
    -v, --version        display version
    -p, --port [port]    set debugger server port
    -e, --entry [entry]  set the entry bundlejs path when you specific the bundle server root path
    -m, --mode [mode]    set build mode [transformer|loader]
    -w, --watch          watch we file changes auto build them and refresh debugger page![default enabled]
start debugger
$weex debug
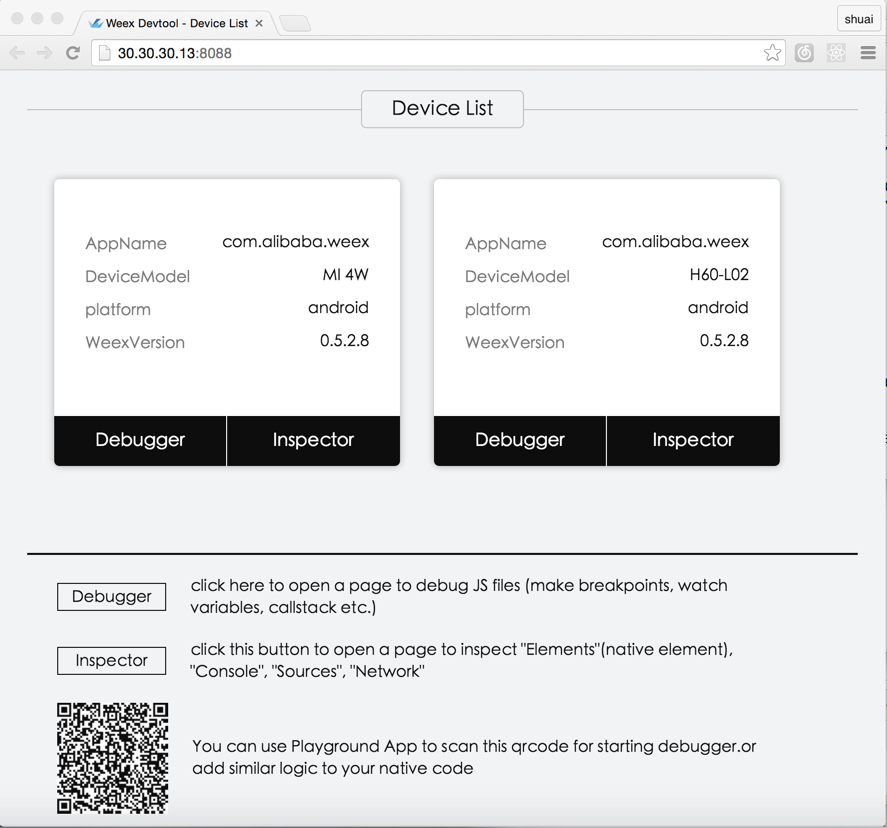
this command will start debug server and launch a chrome opening DeviceList page.
this page will display a qrcode ,you can use Playground App scan it for starting debug.
start debugger with a we file
$weex debug your_weex.we
this command will compile your_weex.we to your_weex.js and start the debug server as upon command.
your_weex.js will deploy on the server and displayed in DeviceList page as another qrcode contain the url of your_weex.js
start debugger with a directory of we files
$weex debug your/we/path -e index.we
this command will build every file in your/we/path and deploy them on the bundle server. your directory will mapping to http://localhost:port/weex/ use -e to set the entry of these bundles. and the url of "index.we" will display on device list page as another qrcode.
Features
Connect devices
Inspector
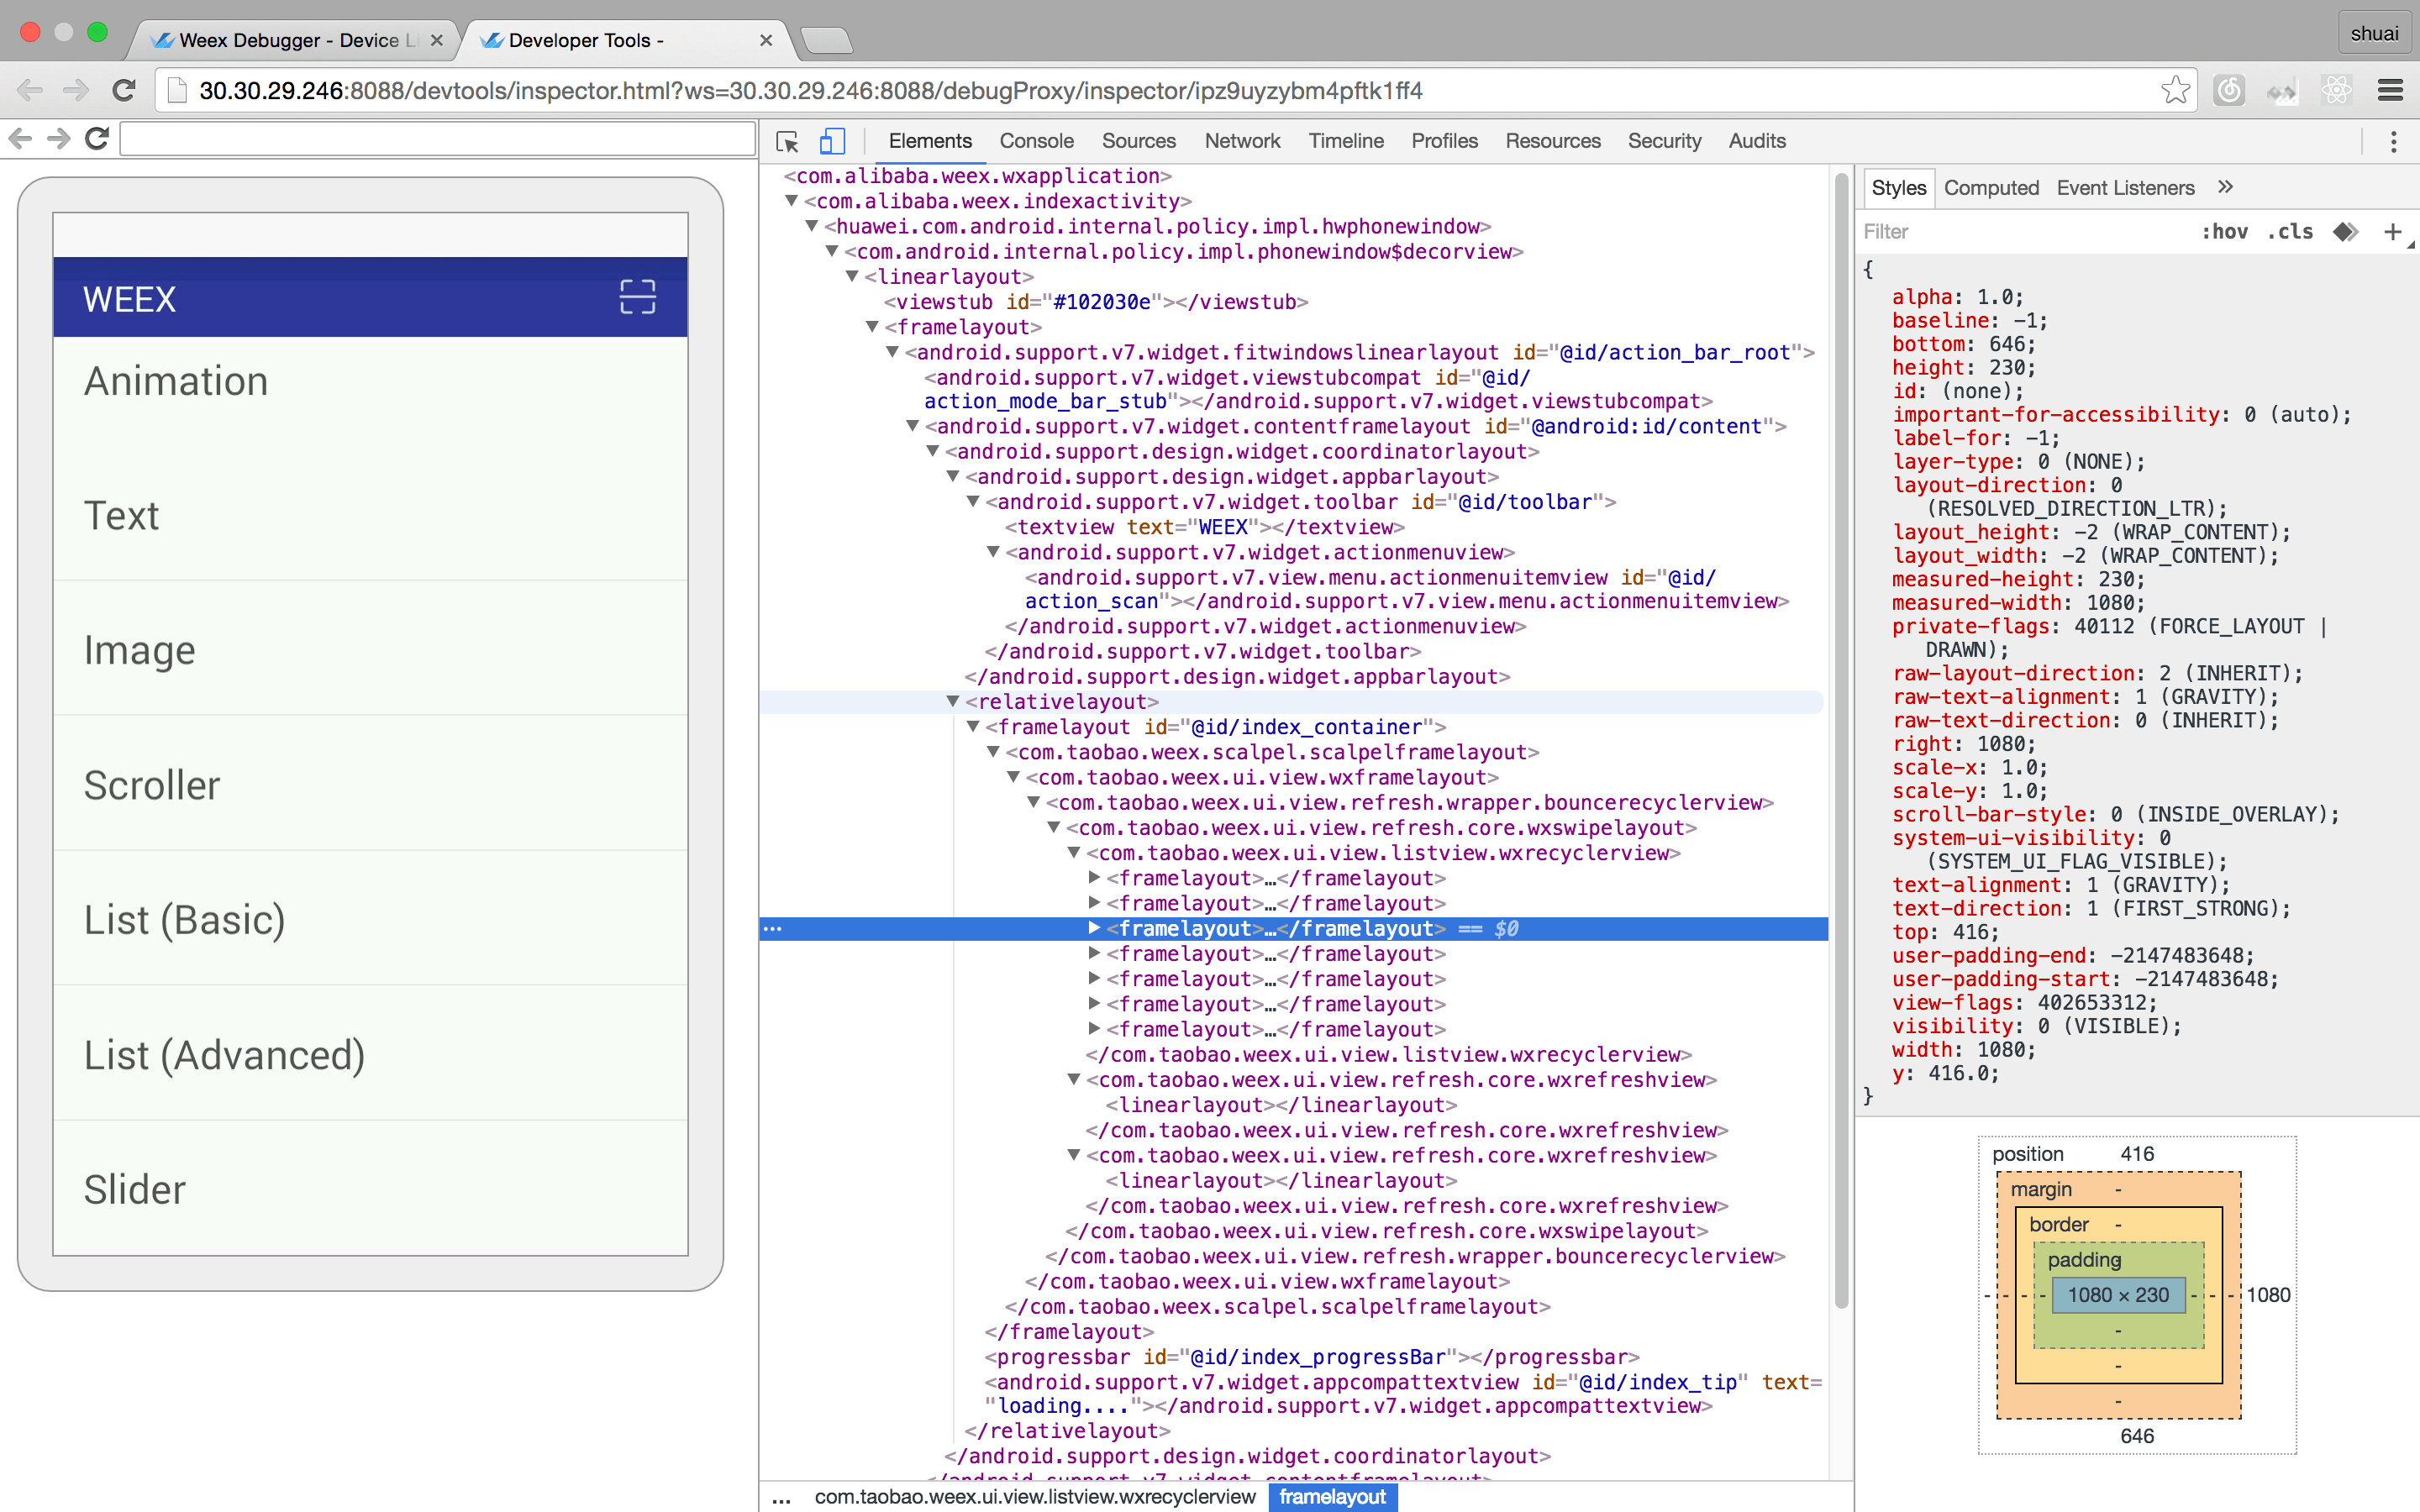
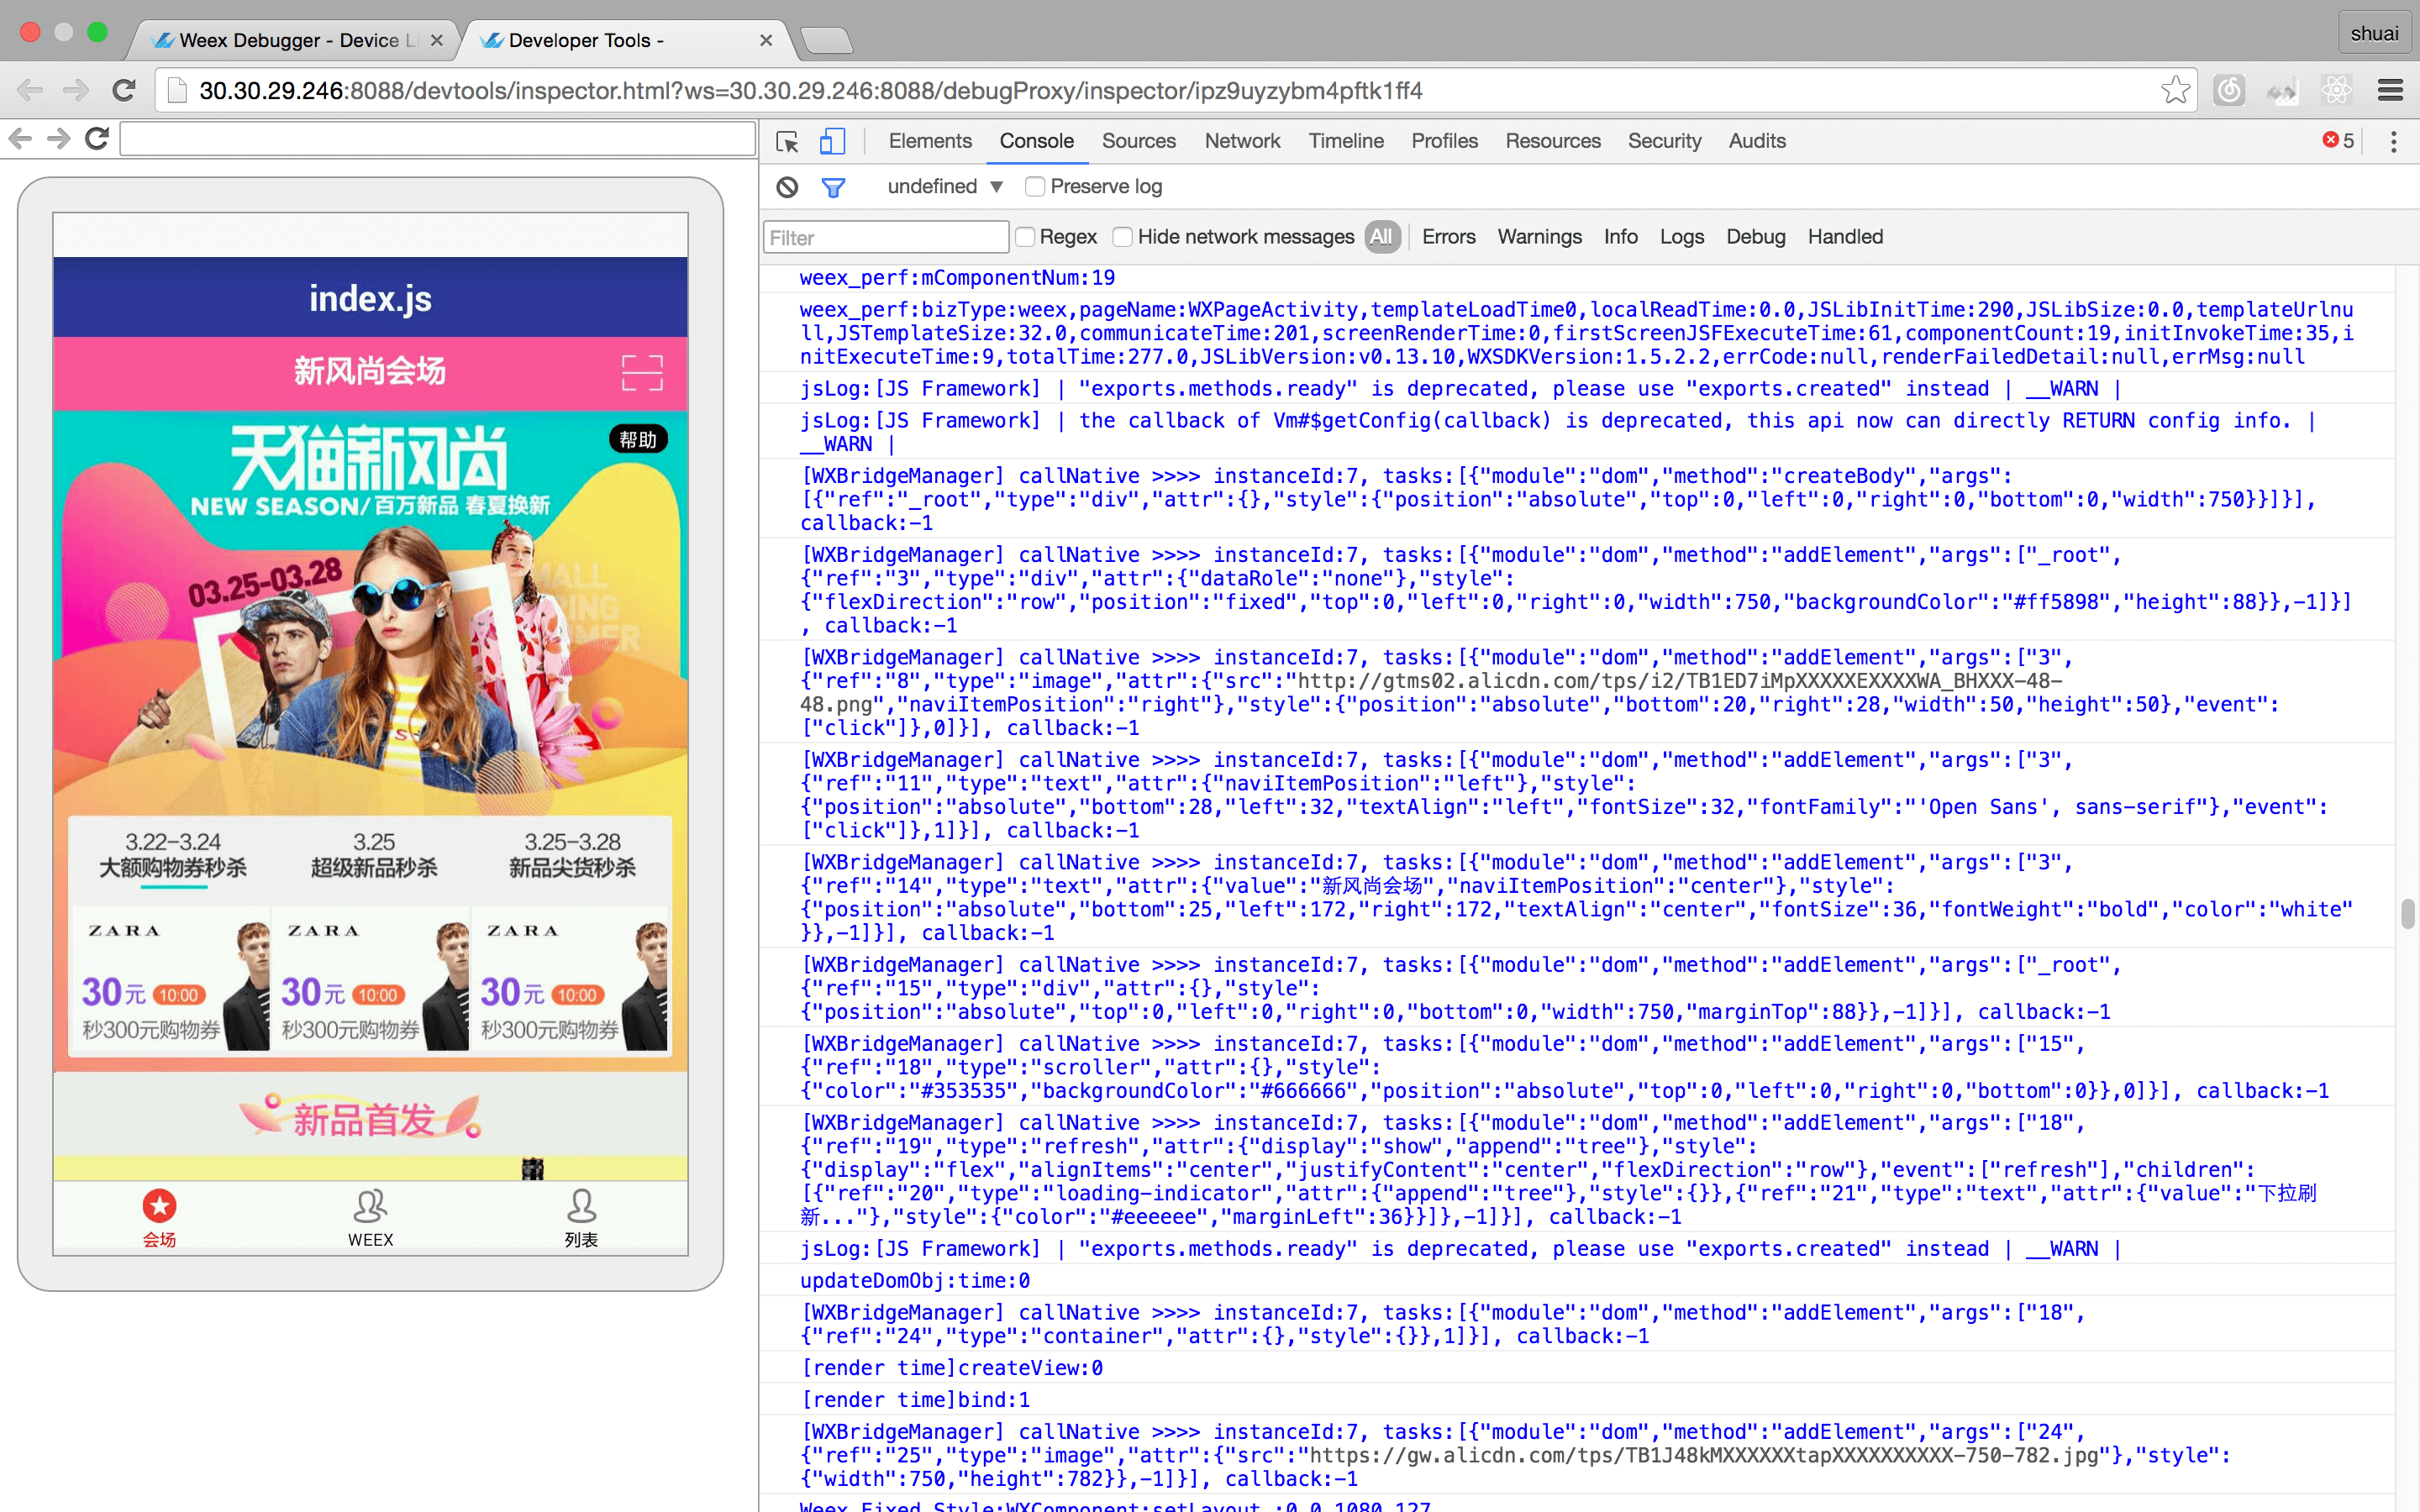
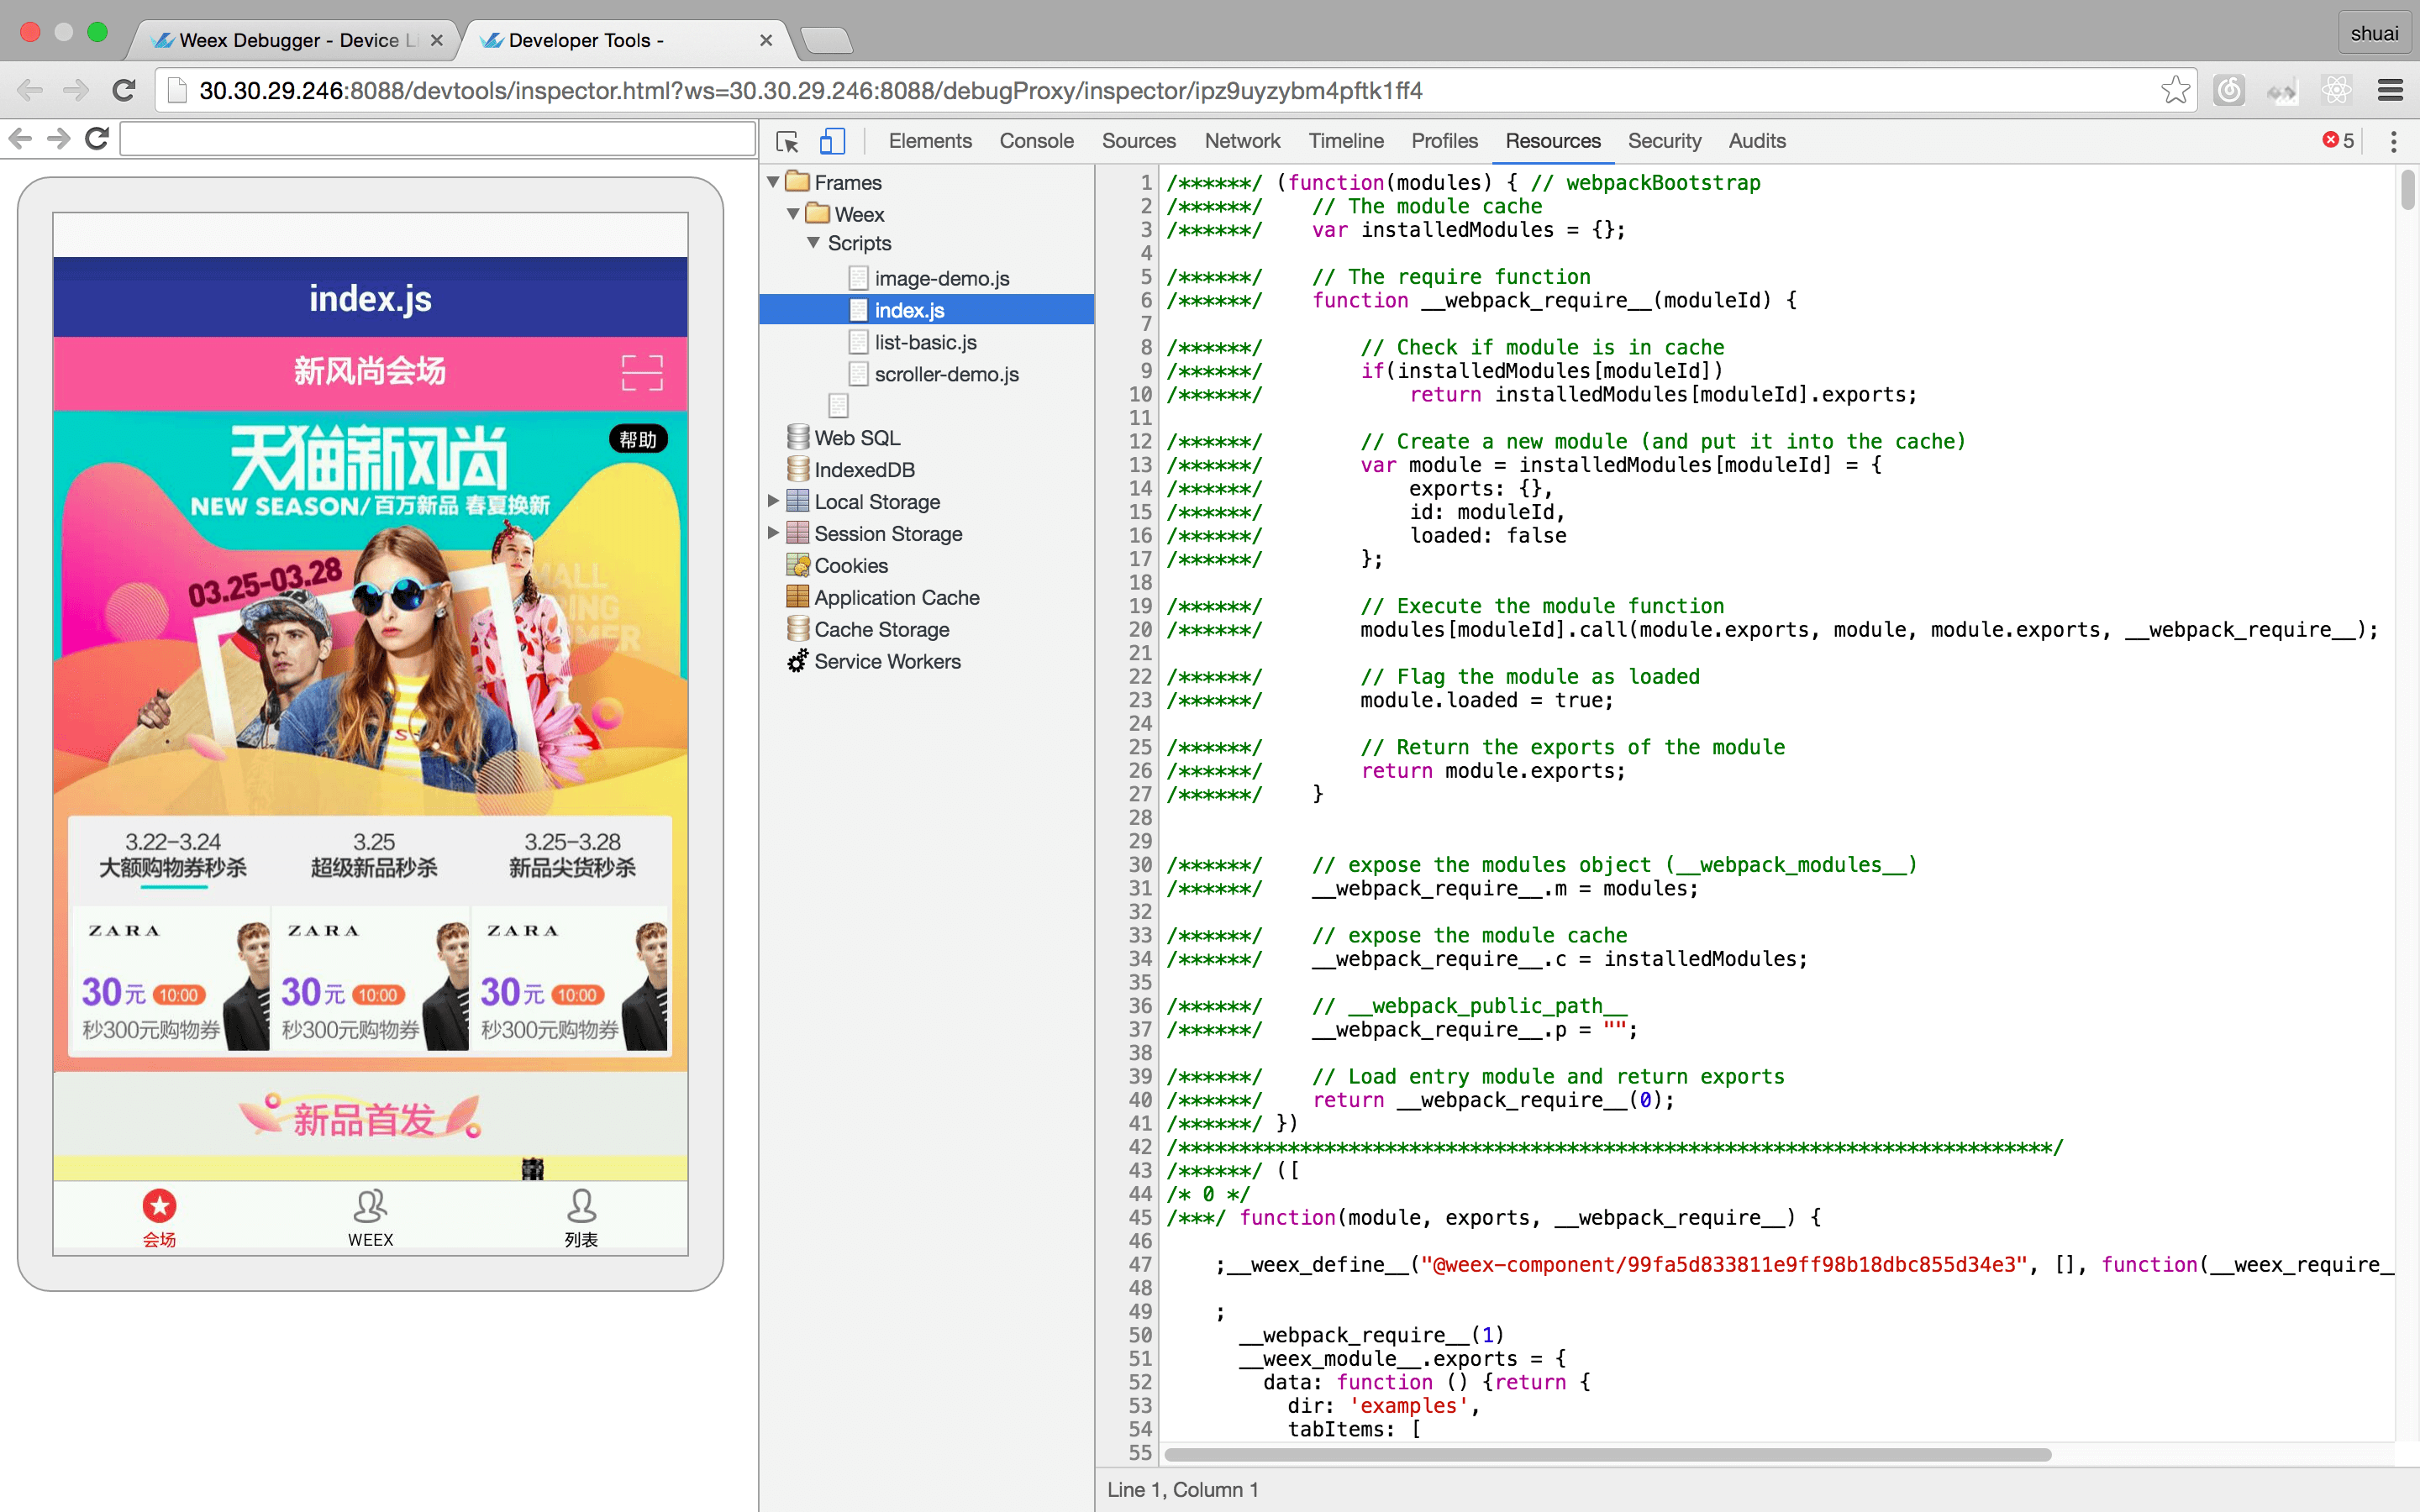
Inspector can be used to show your Element \ NetWork \ Console log \ ScreenCast \ BoxModel \ Native View and so on.
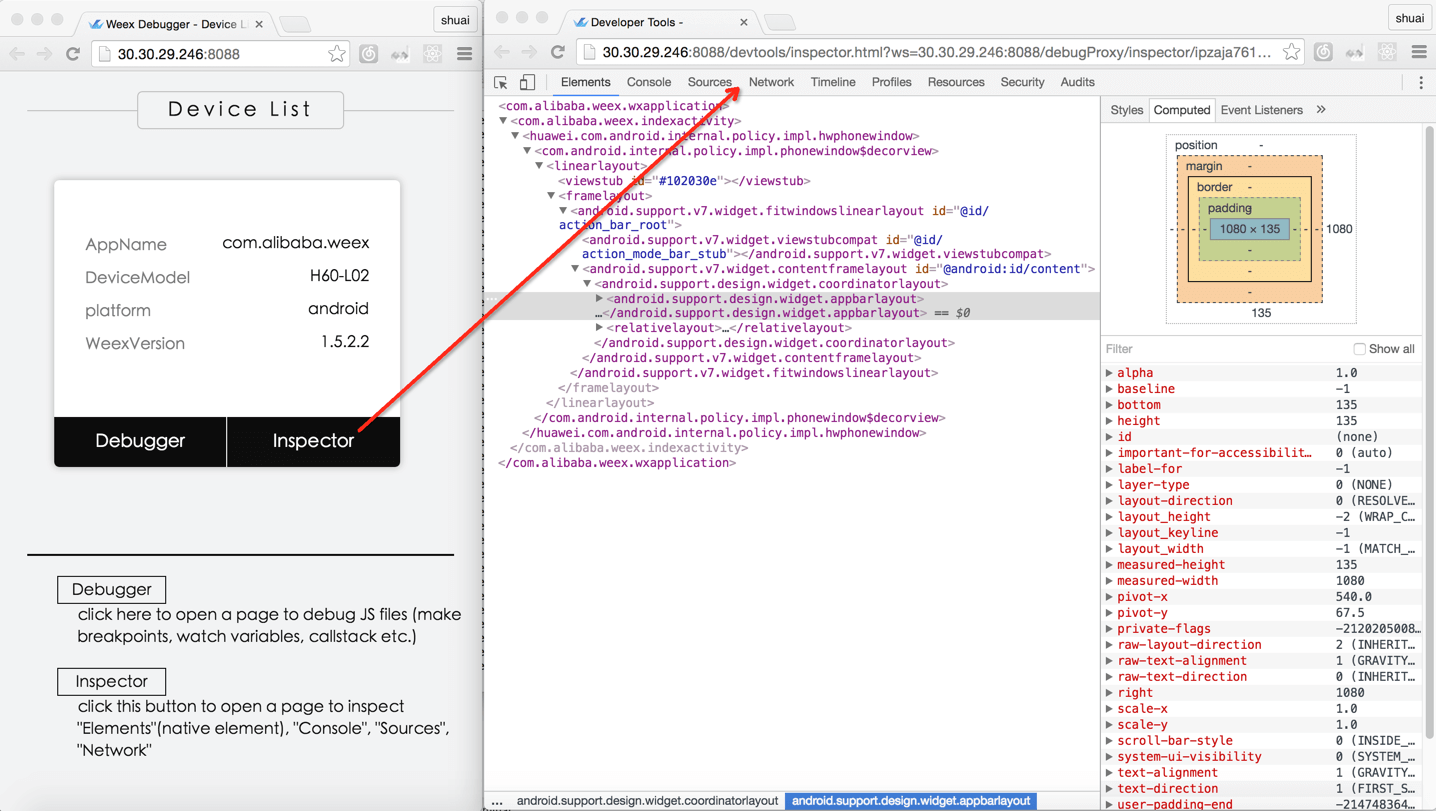
Element
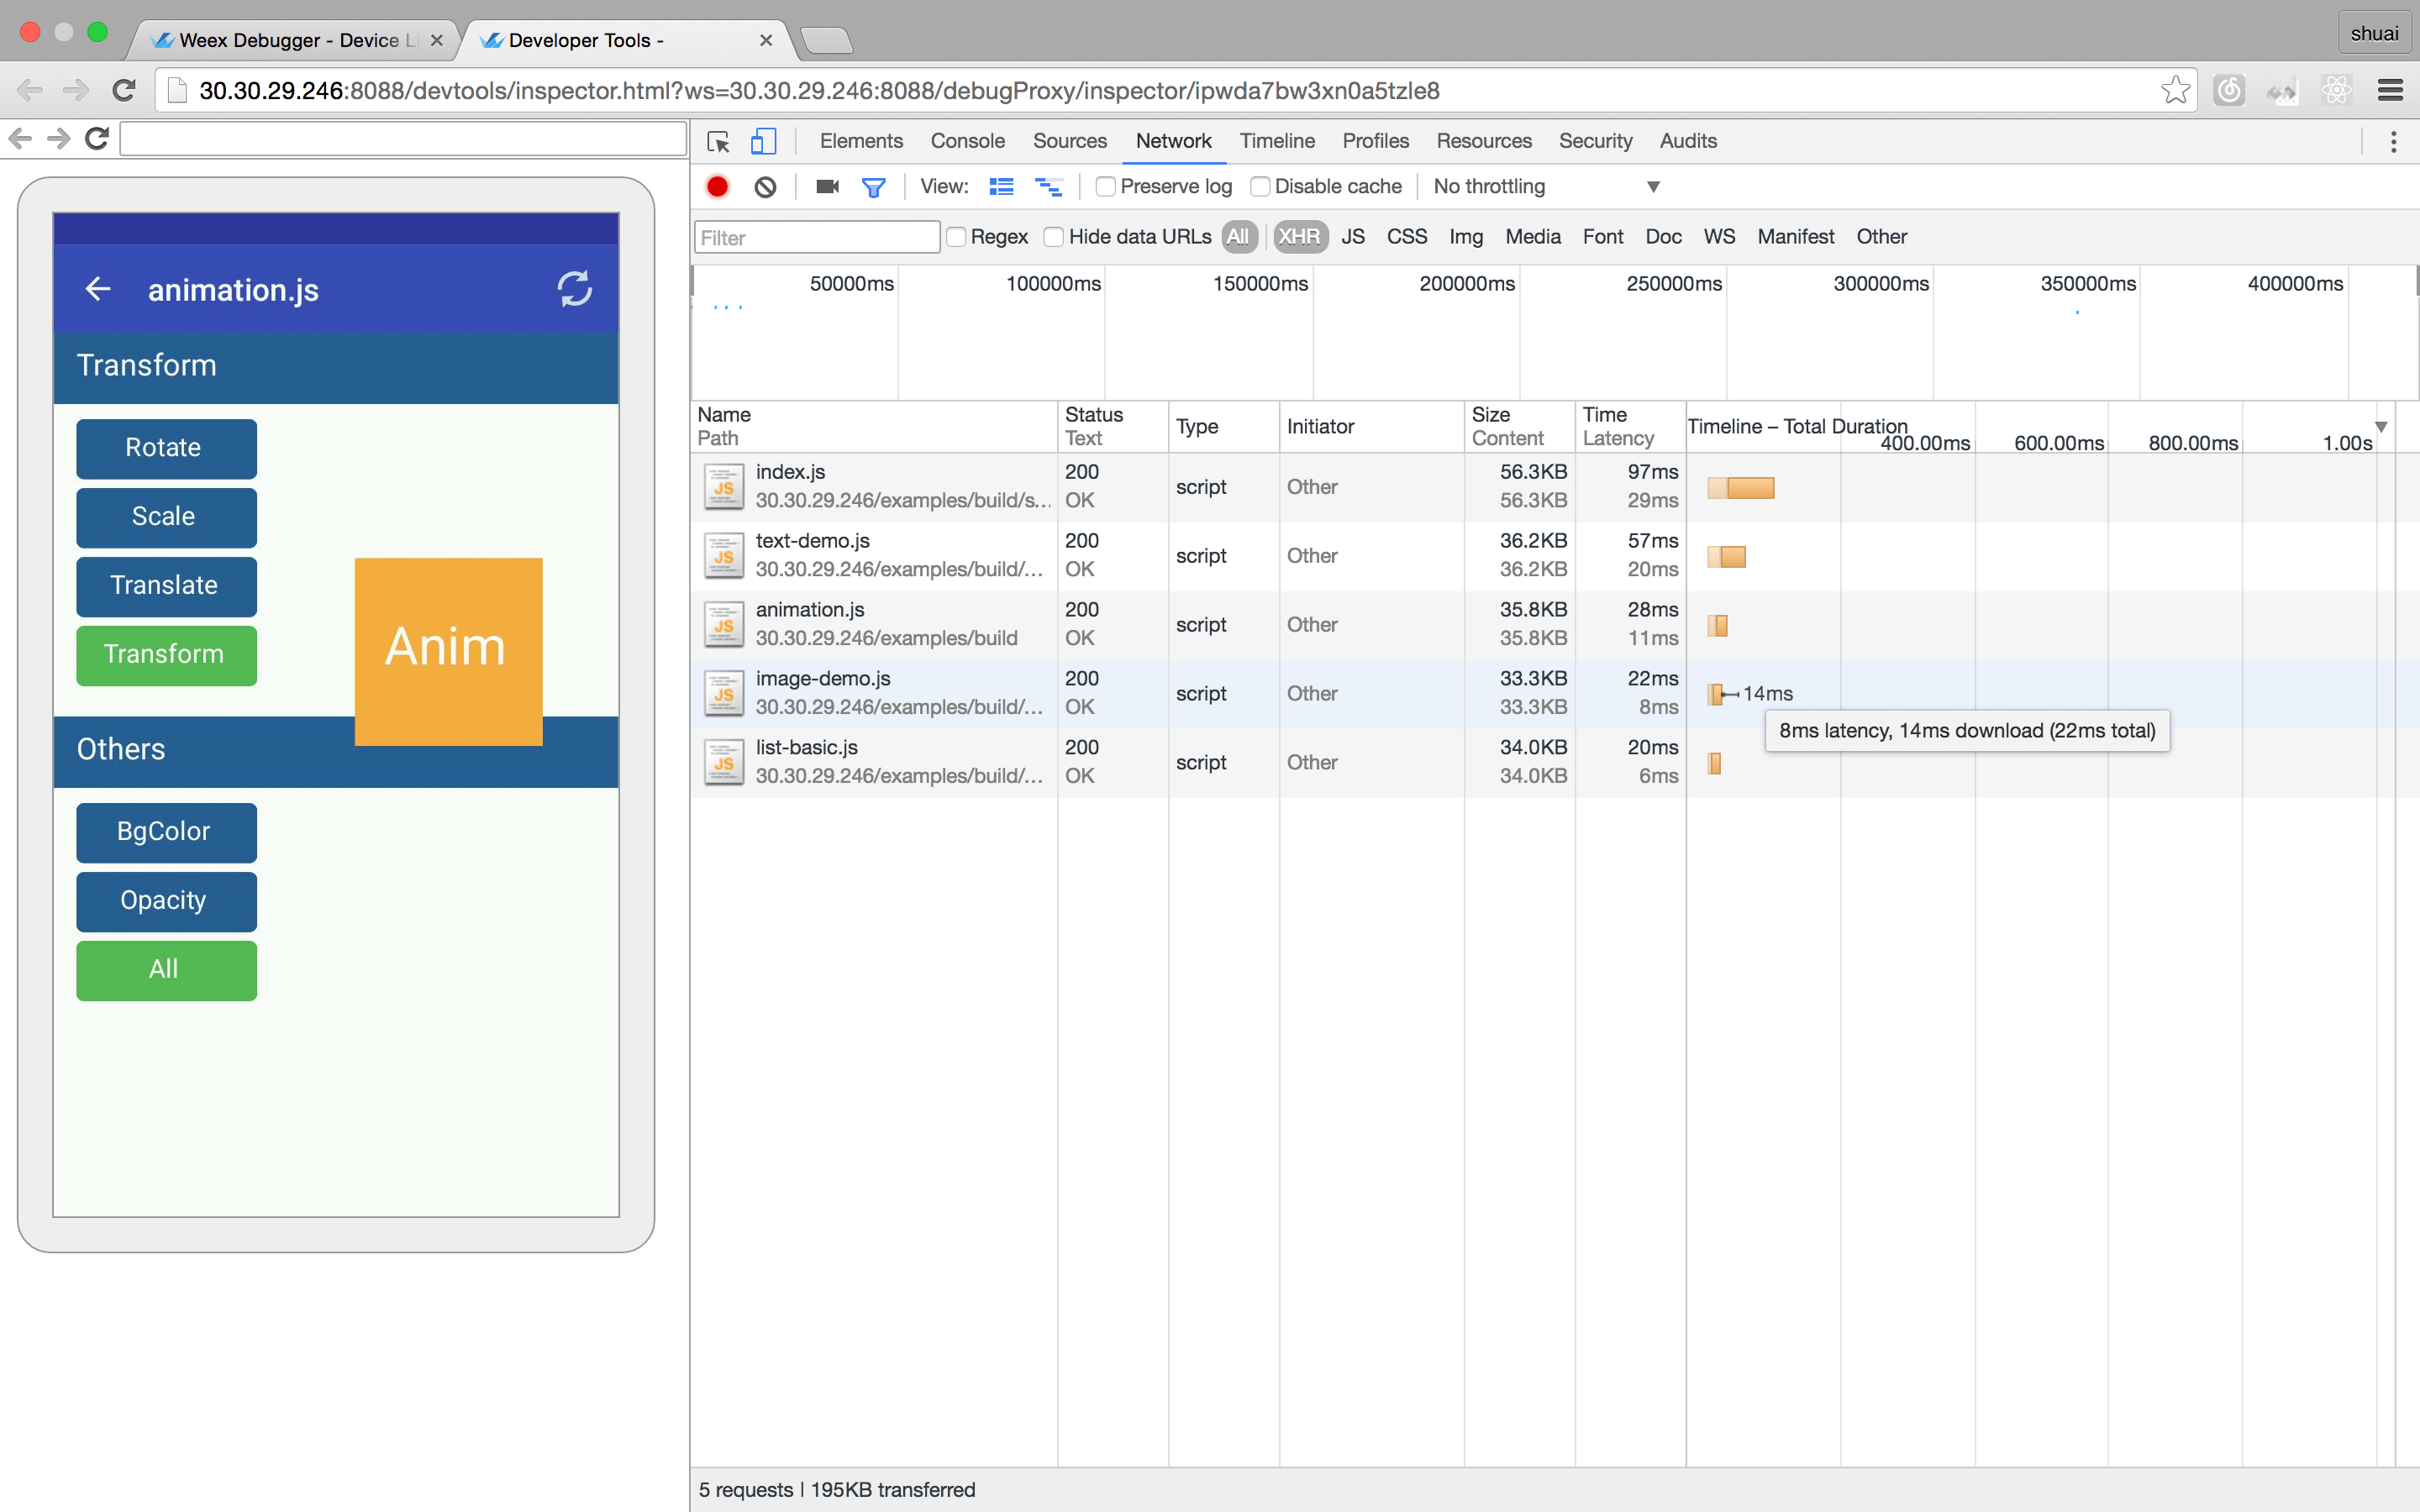
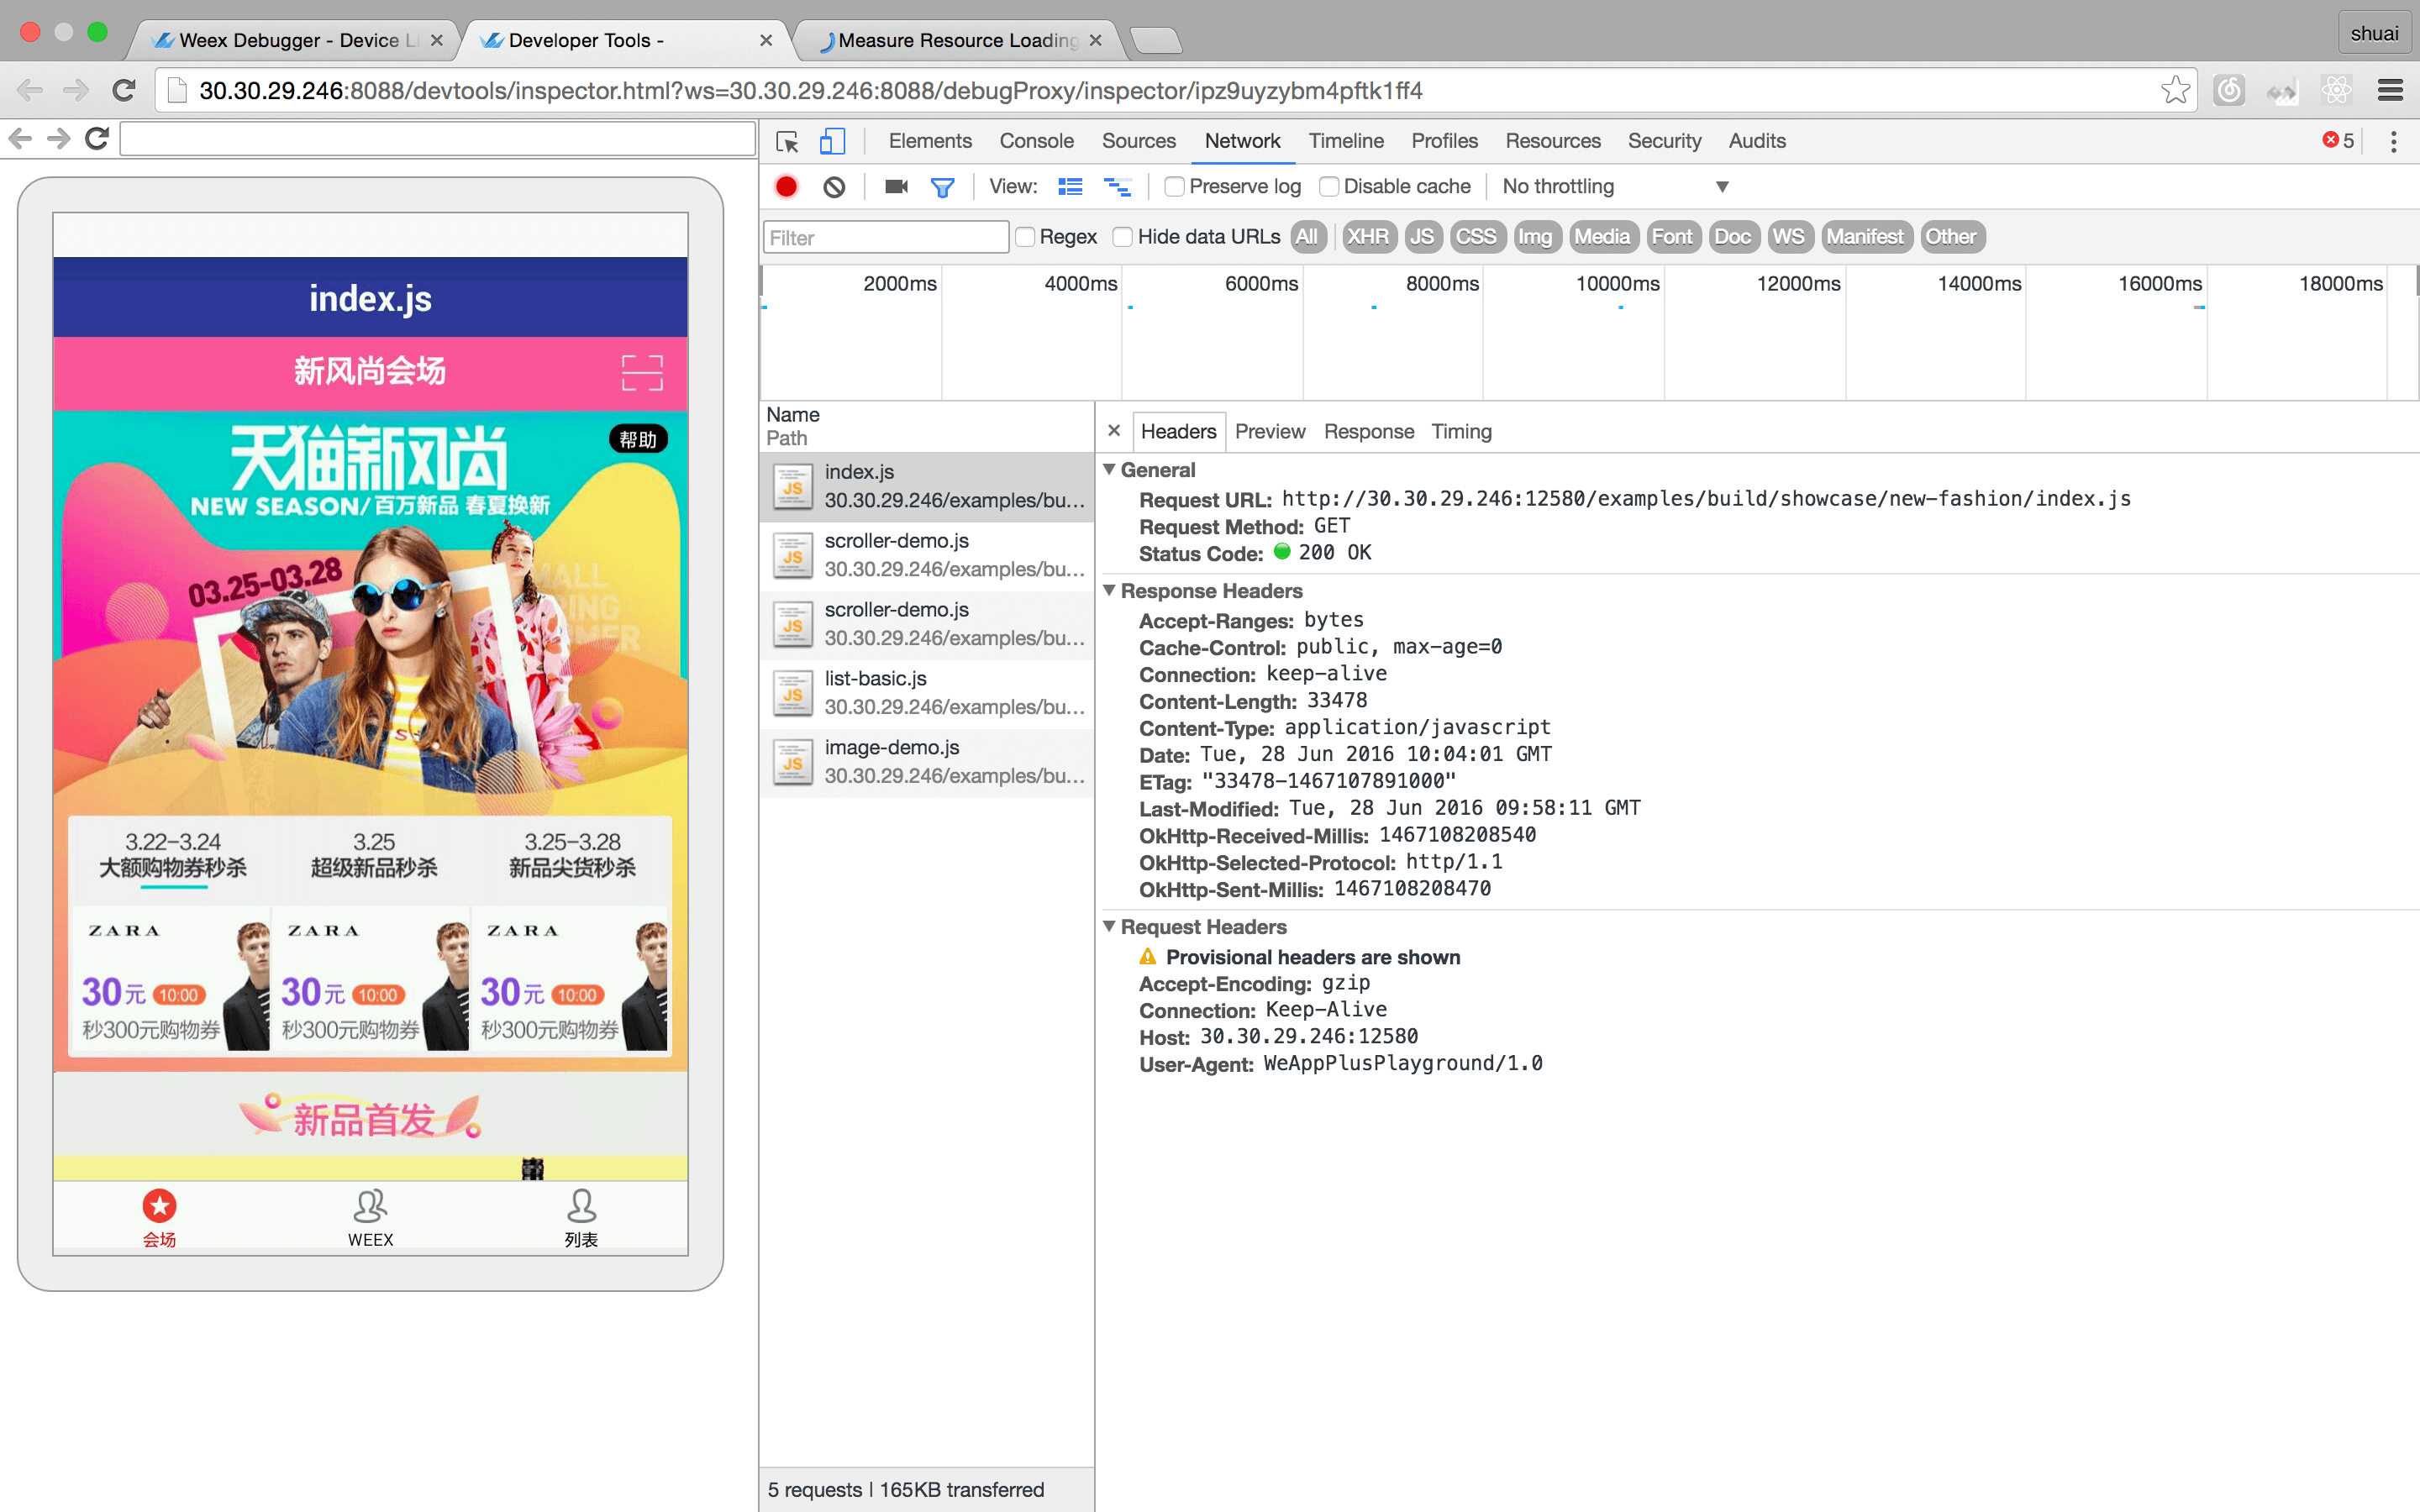
NetWork
show the total time and latency
show the header and response
Console
Resource
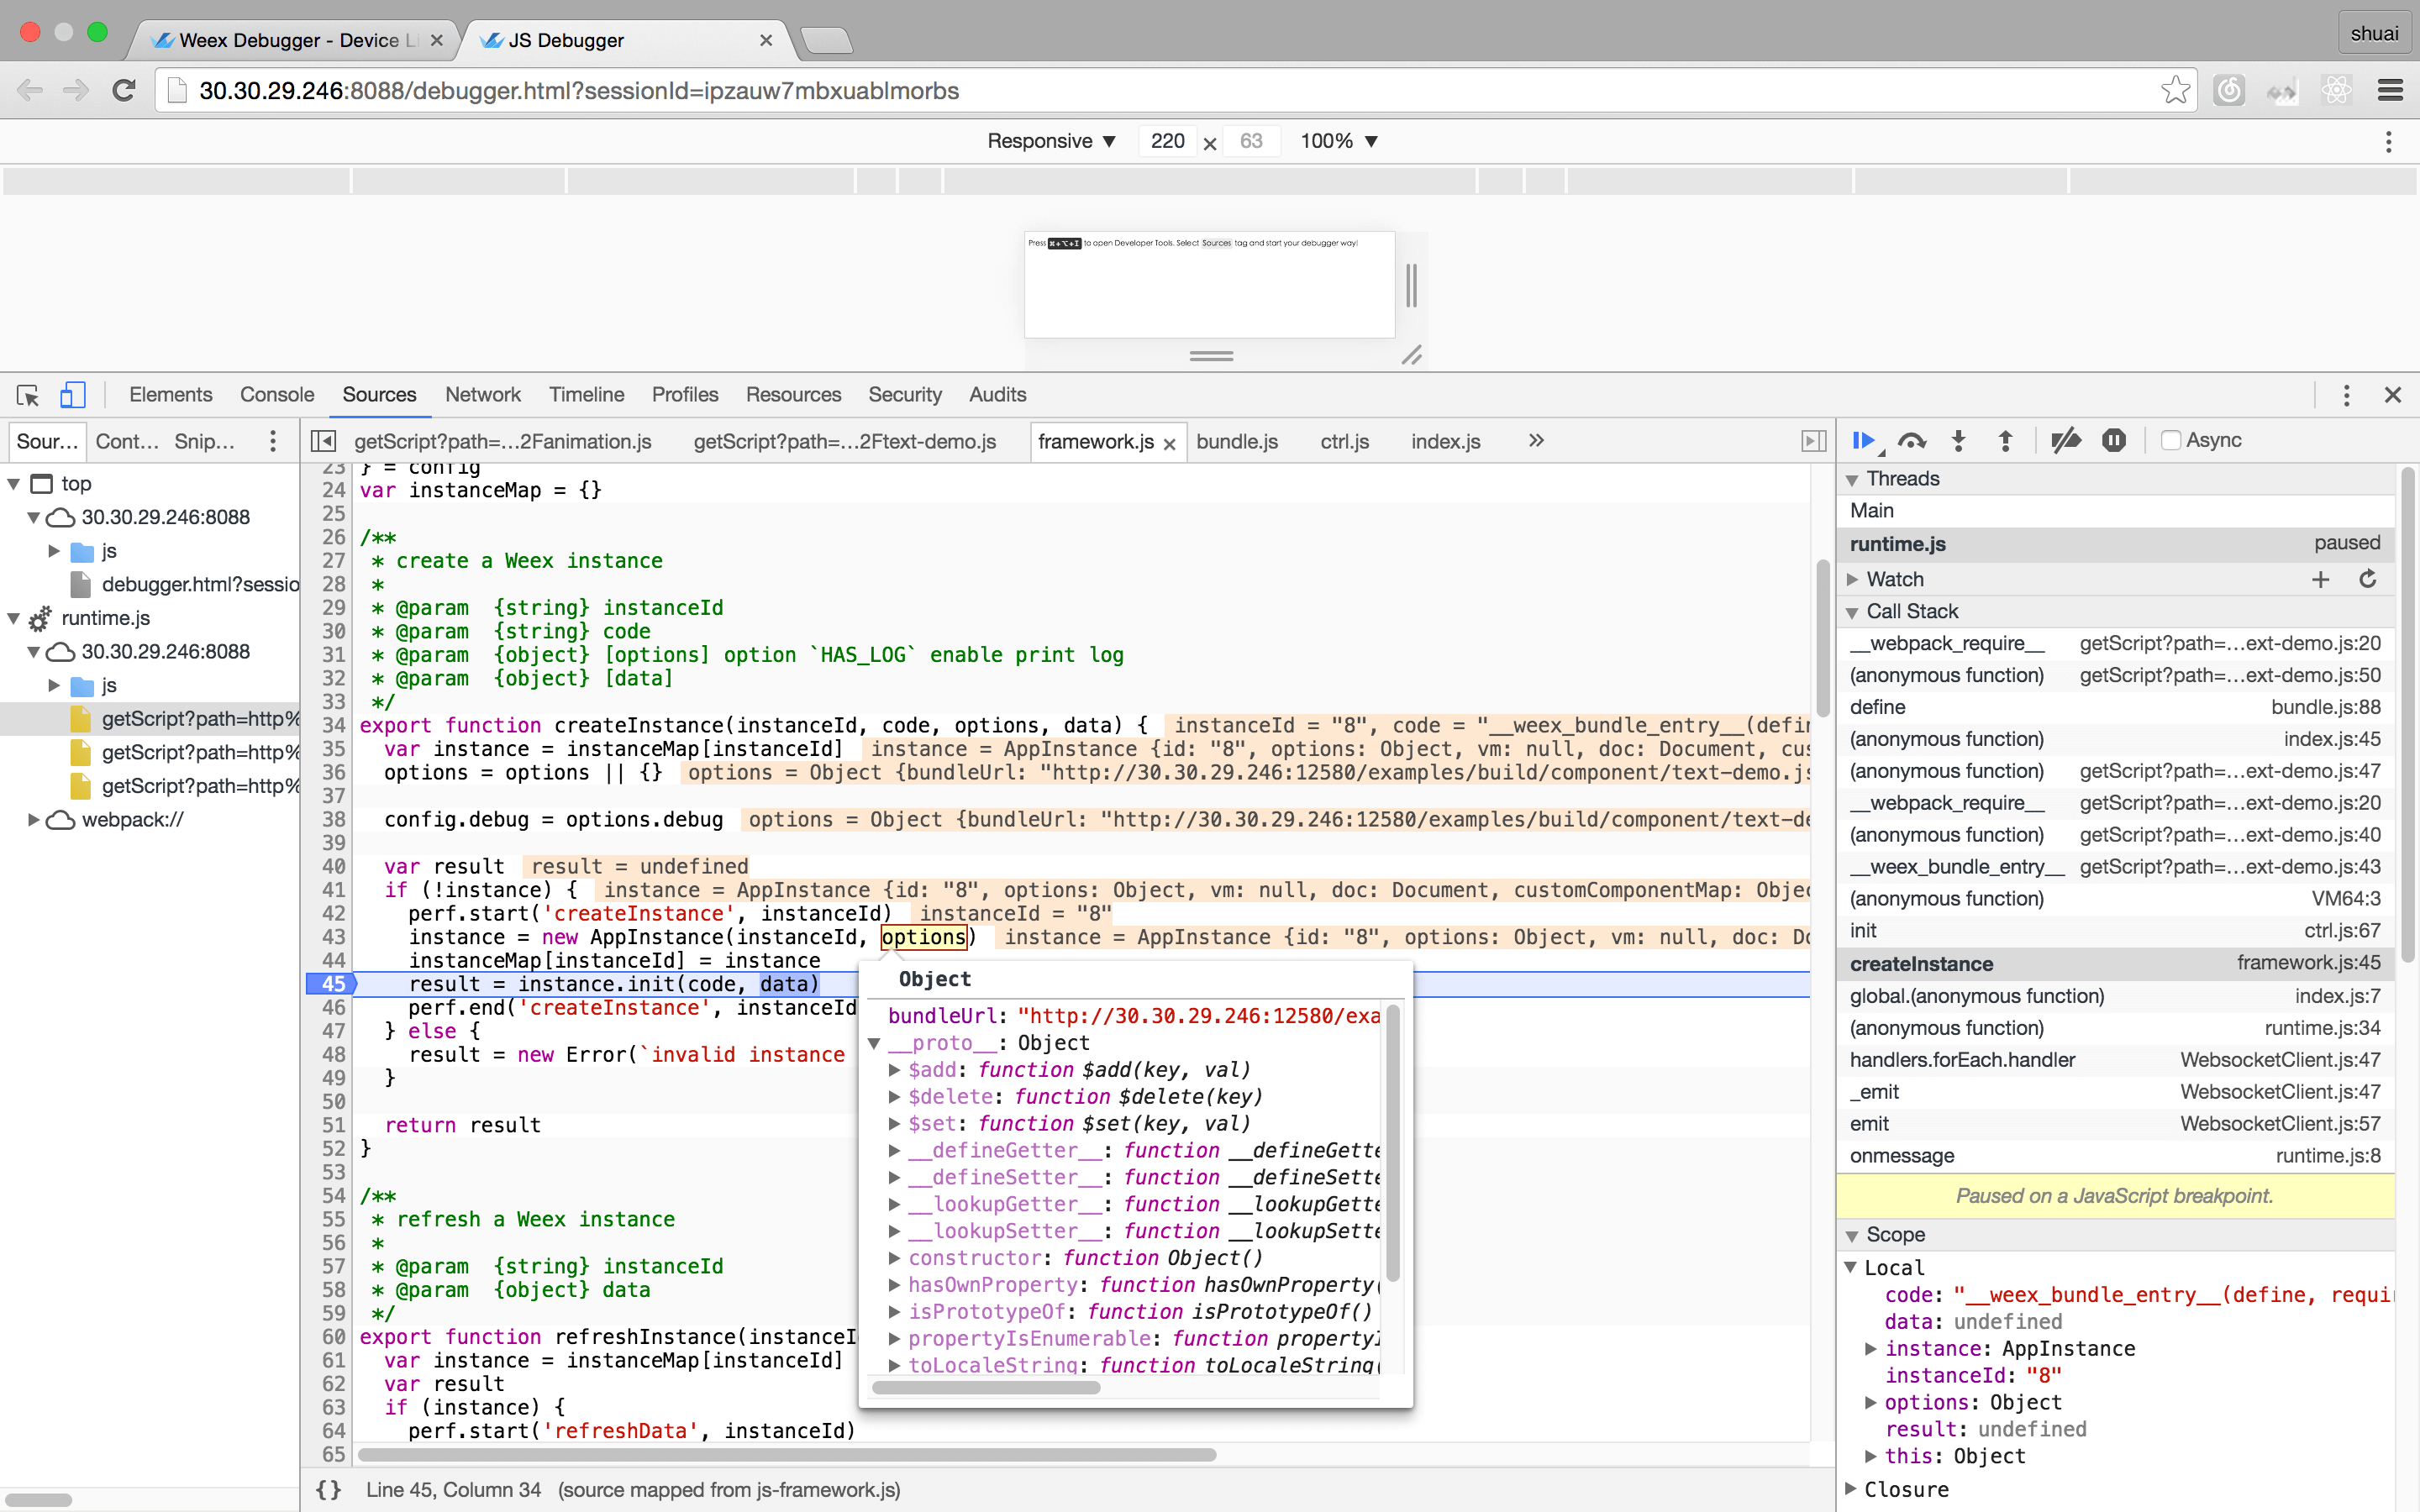
Debugger
Debugger can be used to debug your bundle js source, you can set Breakpoint \ watch CallStack.
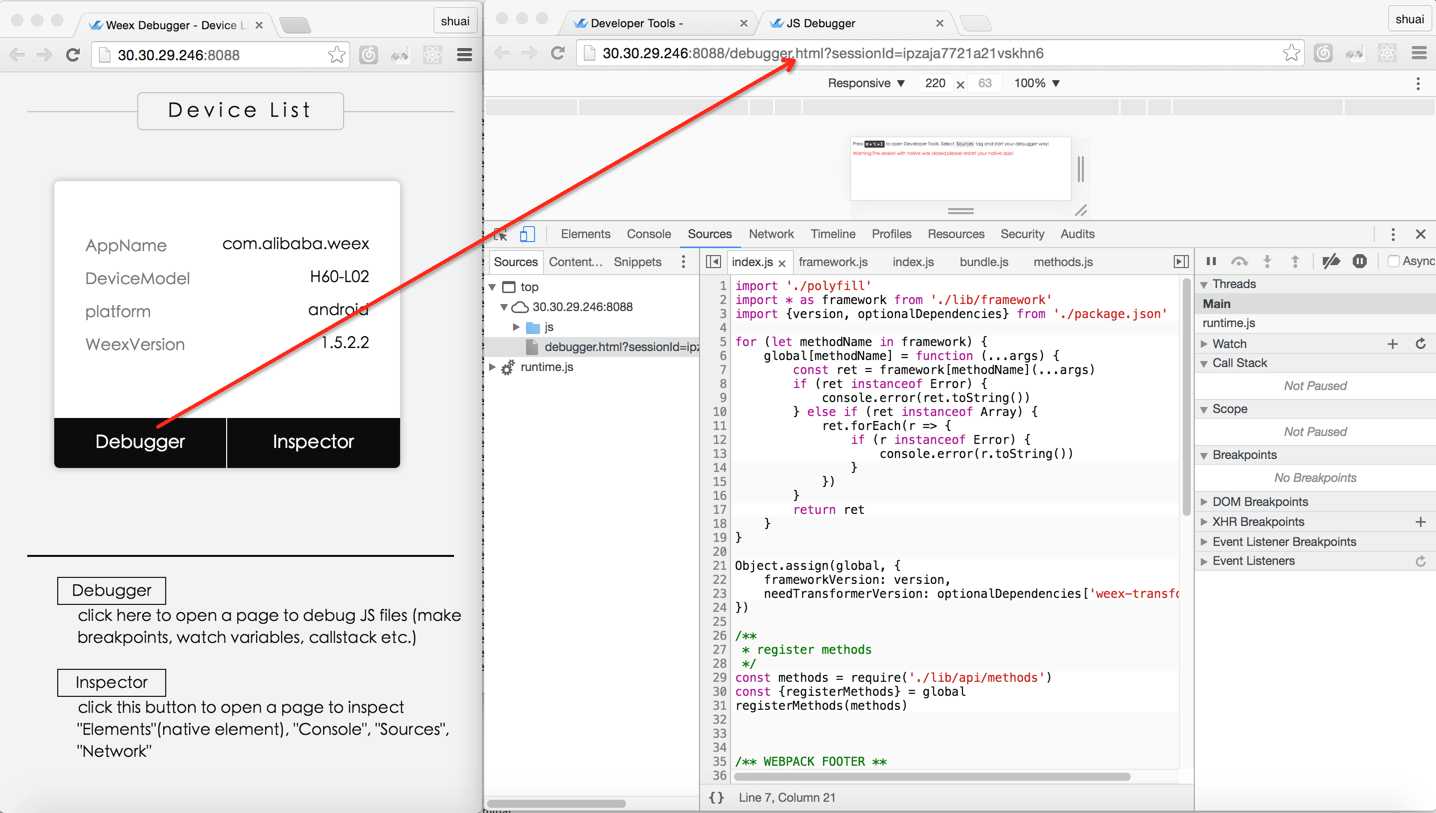
Breakpoint and CallStack
Integrate devtools
- Android
- See the doc Weex devtools (Android), it will lead you to config and use it step by step.
- IOS
- See the doc Weex devtools (IOS), it will lead you to config and use it step by step.